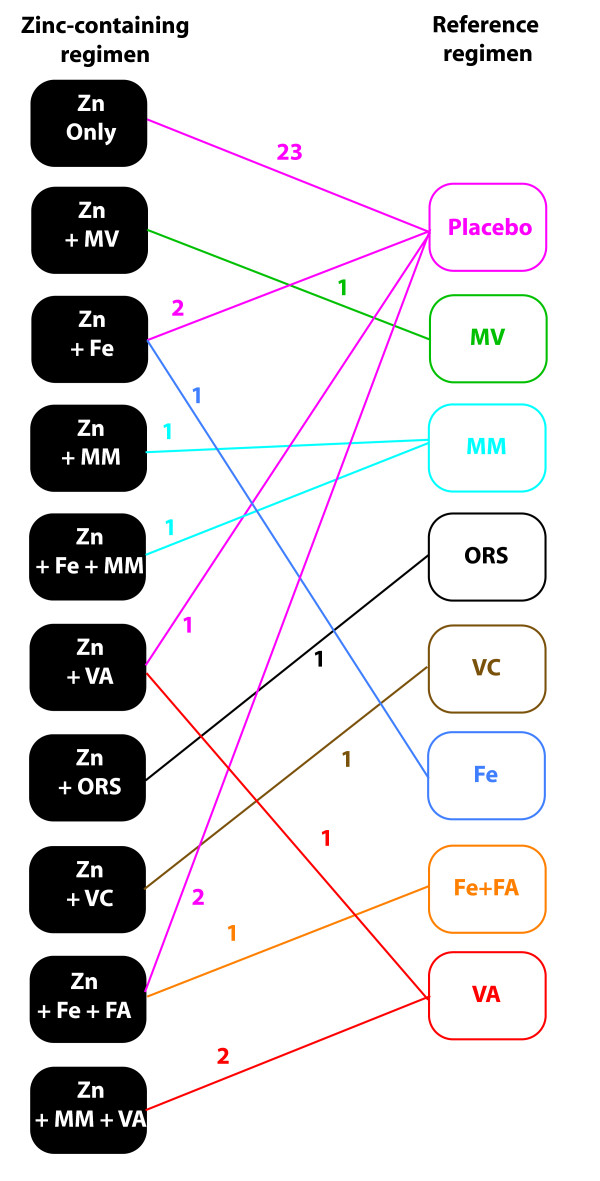
Figure 4.
Network diagram representing various comparisons found in the studies on diarrheal incidence. Eight different reference groups are color coded and so are the comparisons emanating from these reference groups. Each line represents a comparison and the color-coded number alongside the line is the number of trials reporting the specified comparison.

