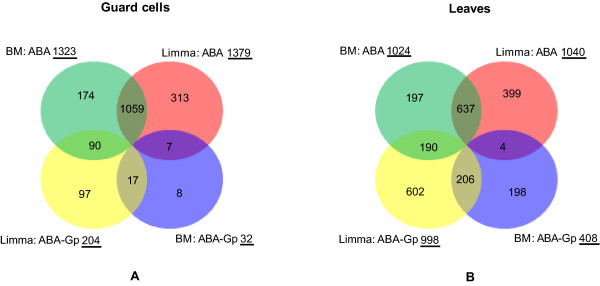
Figure 11.
Overlap distribution of ABA-responsive genes obtained by the two different methods. (A) Guard cells; (B) Leaves. "BM: ABA" and "Limma: ABA" denote the G-protein-independent ABA-regulated genes obtained by the Boolean method and the linear model method, respectively. "BM: ABA-Gp" and "Limma: ABA-Gp" denote the G-protein-dependent ABA-regulated genes obtained by the Boolean method and the linear model method, respectively. The numbers with underlines are the total numbers of genes in the corresponding categories. For guard cells, the ABA-regulated gene set utilized here is the sum of the 1059 + 90 + 7 + 17 genes. For leaves, the ABA-regulated gene set utilized here is the sum of the 637 + 190 + 4 + 206 genes.

