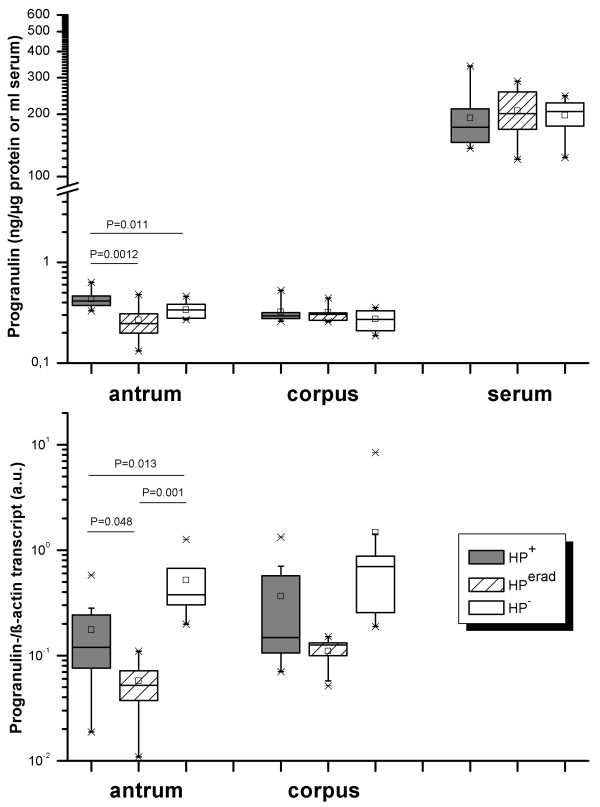
Figure 1.
Progranulin levels in gastric mucosa and serum in relation to H. pylori-status. Data were stratified to location (antrum, corpus, serum) and H. pylori status as indicated by the legend and X-axes. Boxes represent the 25th, 50th and 75th percentile values (horizontal lines of the box) and means (squares). Significant differences were identified by Kruskal-Wallis (for multiple groups) and Mann-Whitney U test (pairwise comparisons) for antrum only; corresponding P-values are shown.

