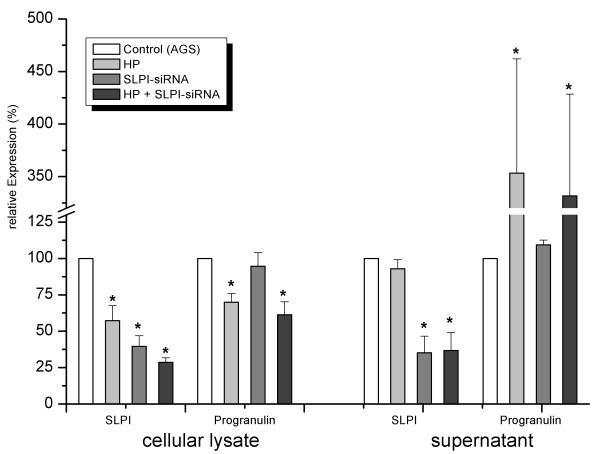
Figure 5.
Expression of Progranulin in relation to SLPI and H. pylori in AGS cells. AGS cells were treated as indicated in the legend and explained in the section "Material and Methods". Data present relative values of 3 individual experiments (each with duplicates). SLPI and Progranulin levels were quantified by ELISA; control values (100%) were for SLPI: 64.3 ± 15.2 pg/50 μg and 452.4 ± 116.4 pg/ml and Progranulin 1.2 ± 0.09 ng/50 μg and 0.36 ± 0.1 ng/ml. Control transfection experiments using "all-star-negative"™ siRNA (Qiagen) as negative control showed a reduction of SLPI levels to 82.1 ± 6.3% and 82.3 ± 19.2% for lysate and supernatant, respectively (n = 3, each duplicates). Cells were transfected with siRNA, infected with H. pylori after 48 h and harvested after 72 h. Asteriks (*) illustrate significant changes in relation to corresponding control (two-sided paired T test, P < 0.05). Global test for multiple groups (ANOVA) was significant for all four groups (P < 0.05).

