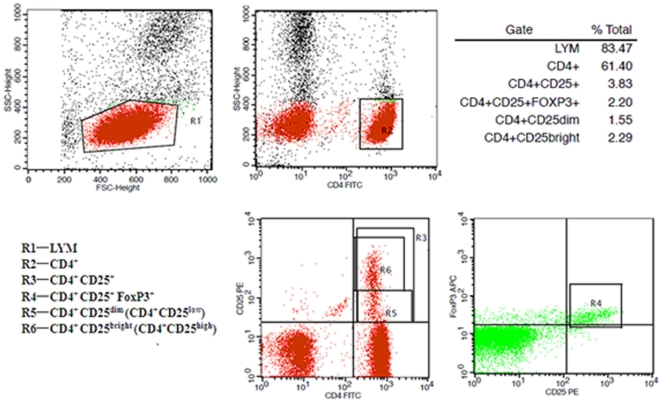
Figure 1. Phenotypic expressions on Tregs.
Peripheral lymphocytes were analyzed for CD4-FITC, CD25-PE and Foxp3-APC expressions. The graphs showed that CD4+ T cells gated by R2 were isolated from lymphocytes and divided into CD4+CD25+(R3), CD4+CD25+Foxp3+ (R4), CD4+CD25low (R5) and CD4+CD25high (R6). Data represented the results of one representative experiment out of seven performed under the same conditions.

