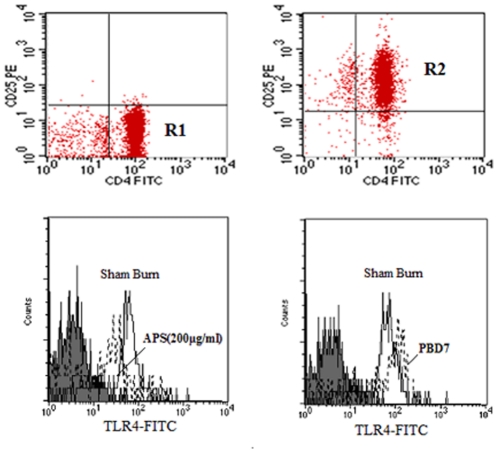
Figure 5. Changes of TLR4 expression on CD4+CD25+Tregs.
CD4+CD25+Tregs (R2) and CD4+CD25−T cells (R1) were isolated from the peripheral blood of male BALB/c mice by magnetic beads and analyzed by flow cytometry. The expression of TLR4 on CD4+CD25+Tregs was stained with the indicated FITC-antibodies. Data were represented by a histogram in which gray area represents isotype-matched control mAbs, solid lines represent CD4+CD25+Tregs isolated from sham burn mice, and dotted lines represent CD4+CD25+Tregs also stimulated with APS(200 µg/ml) for 24 hr or isolated from burn plus infection mice at PBD7. Data represent the results of one representative experiment out of seven.

