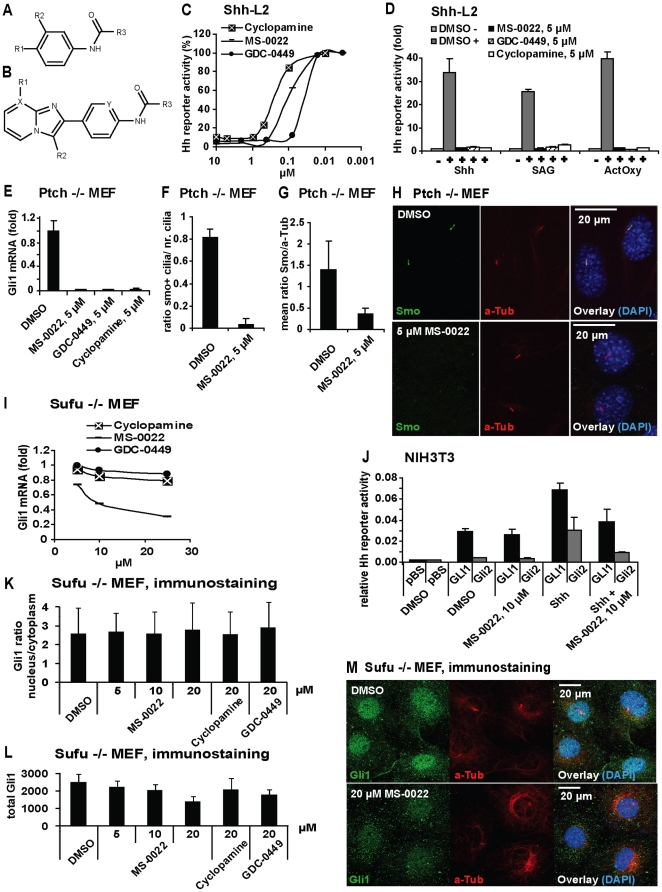
Figure 1. Identification and activity of MS-0022.
A) Structure for Table 1. B) Structure for Table 2. C) Dose response curves of indicated compounds in Shh activated Shh-L2 cells after 48 hours treatment (n = 8). D) Shh-L2 cells activated with Shh, 200 nM SAG and ActOxs (5 µM+5 µM) treated with indicated compounds at 5 µM for 48 hours. Graph displays fold Hh reporter activity with standard deviation (SD) (n = 3). The basal activity (DMSO) was set as = 1. E) Normalized (GADPH) Gli1 mRNA expression in Ptch−/− MEF after 48 hours of treatment with indicated compounds at 5 µM. Graph displays fold expression compared to DMSO control, with SD (n = 3). F–H) Immunostaining of Ptch −/− MEF cells treated with MS-0022 or DMSO control for 24 hours (anti-smoothened (Smo) in green, anti acetylated Tubulin (aTub) in red, DAPI in blue). Treated and control culture slides (n = 3) were stained and 3 regions on each slide was imaged and analyzed. F) Graph displaying the ratio of Smo positive cilia versus total number of cilia in stained cells by eye count, with SD. G) Graph displaying the ratio of mean ciliary intensity of Smo staining versus aTub as quantified using ImageJ software, with SD. I) Dose response curve of MS-0022, GDC-0449 and cyclopamine by normalized (GAPDH) Gli1 mRNA expression in Sufu −/− MEF after 72 hours treatment (n = 3). J) NIH3T3 cells cotransfected with GliBS-Luc in combination with pBluescript (pBS), FL-GLI1-HA or Gli2-GFP, were treated with DMSO, 50% Shh conditioned medium, 10 µM MS-0022 and a combination of Shh and 10 µM MS-0022 for 48 hours. Graph displays relative Hh pathway activity (reporter firefly luciferase normalized for renilla transfection control), with SD (n = 3). K–M) Immunostaining of Sufu−/− MEF cells treated with DMSO control, MS-0022 (5, 10 and 20 µM), cyclopamine (20 µM) and GDC-0449 (20 µM) for 48 hours (n = 3). K) Graph displaying ratio of nuclear Gli1 staining intensity versus cytoplasmic Gli1 staining intensity, with SD. L) Graph displaying sum of nuclear and cytoplasmic Gli1 staining intensity in treated cells, with SD.

