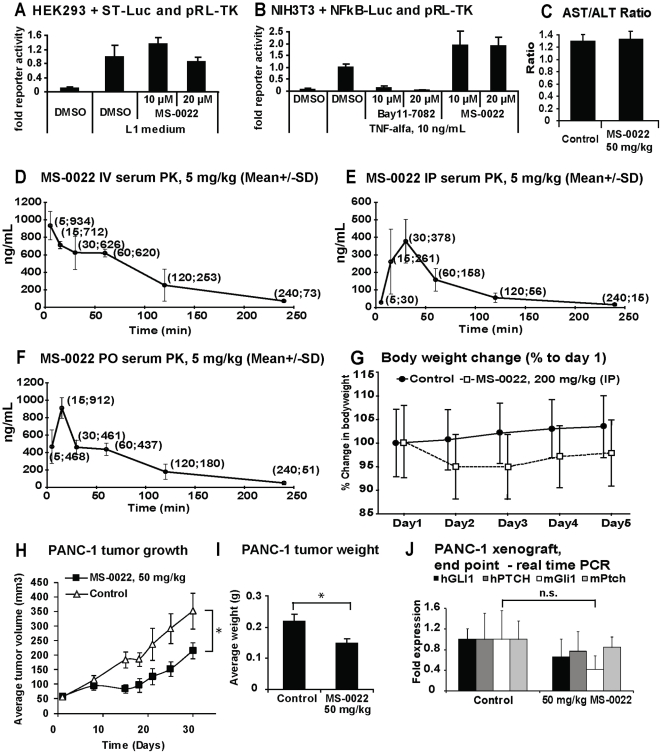
Figure 3. In vitro MS-0022 pathway selectivity, in vivo tolerance and distribution, and activity in a PANC-1 xenograft model.
A) HEK293 cells cotransfected with SuperTop-luc (ST-Luc) and pRL-TK, were treated with control medium and L1 medium +/− 10 and 20 µM MS-0022 for 24 hours. Graph displays fold reporter activity with standard deviation (n = 3). B) NIH3T3 cells cotransfected with NFkB-luc and pRL-TK, treated with control medium and 10 ng/mL TNF-α +/− 10 and 20 µM NFkB inhibitor Bay11-7082 or 10 and 20 µM MS-0022 for 24 hours. Graph displays fold reporter activity with SD (n = 3). C) Graph depicting average AST/ALT ratio from mouse blood at end of animal treatment in the PANC-1 xenograft. D–F) Blood distribution curves after IV, IP and PO administration of 5 mg/kg MS-0022 in mice. Graphs display mean dose (ng/mL by time) +/− SD. G) Body weight change in animals treated with 200 mg/kg MS-0022 over 5 days, with SD (n = 5). H–J) Analysis of subcutaneous PANC-1 tumors in mice treated with solvent control or 50 mg/kg MS-0022 for 21 days (n = 6) by IP administration. H) Growth curves of PANC-1 tumors in mice after 30 days of treatment, showing average tumor volume (mm3) with standard error of the mean (SEM). I) Graph displaying average PANC-1 tumor weight at end of treatment, with SD. J) Graph displays normalized (GUSB) fold expression of mouse and human Gli1 and Ptch in treated tumors, with SD (n = 3). * = P value <0.05. (n.s. = P value >0.05).

