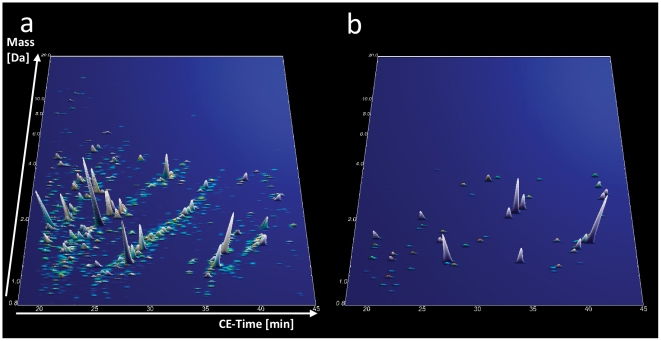
Figure 3. Compiled urinary protein profiles of ERT treated female Fabry patients (a).
Normalized MS molecular weight (800–20,000 Da) in logarithmic scale is plotted against normalized CE migration time (18–45 min). The mean signal intensity of polypeptides is given as peak height. (b) 3-D contour plots of the 64 specific markers in the treated Fabry cohort with 5× zoom compared to (a). Note that the proteomic pattern resembles more that of healthy controls (Figure 1b and d) than that of untreated female Fabry patients (Figure 1a and c).

