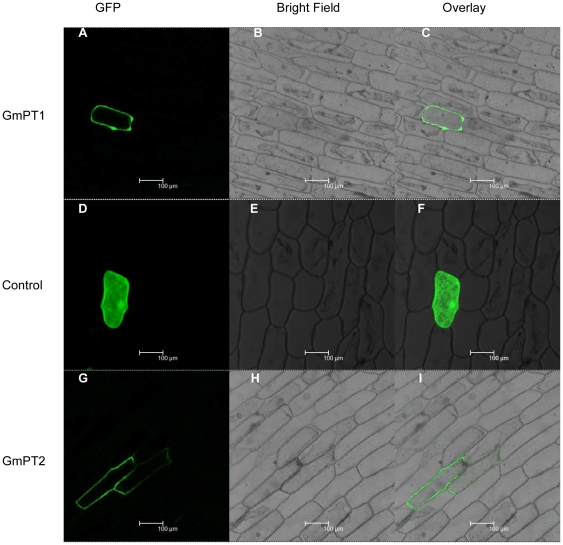
Figure 4. Subcellular localization of GmPT1/GFP and GmPT2/GFP fusion.
Images showing onion epidermal cells expressing GmPT1/GFP (A–C), empty vector (D–F) and GmPT2/GFP (G–I) fusion protein examined under fluorescent-field illumination (A, D and G) to examine GFP fluorescence; under bright-field illumination (B, E and H) and by confocal microscopy for the overlay of bright and fluorescent illumination (C, F and I). The scale bars represent 100 µM.

