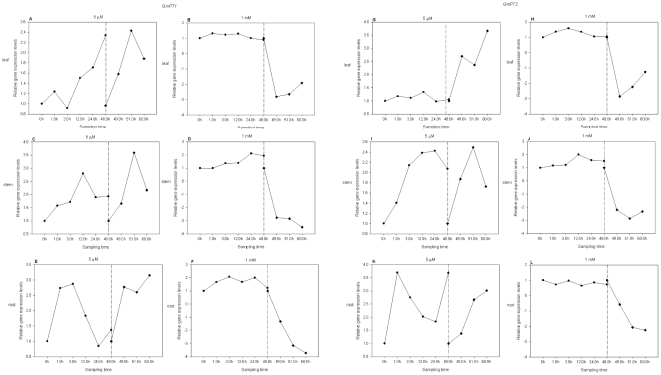
Figure 7. Expression levels of GmPT1 (A–F) and GmPT2 (G–L) during Pi treatment.
The 7-day-old seedlings were grown by hydroponic culture with 0.5×Hoagland solution containing 5 µM Pi (A, C, E, G, I and K) or 1 mM Pi (B, D, F, H, J and L). Seedling tissues were harvested at 0, 1.0, 3.0, 12.0, 24.0 and 48.0 h after treatment (on the dash-dot line at the left). After treatment for 48 h, the deficient/sufficient Pi-treated seedlings were transferred to sufficient/deficient Pi in Hoagland solution, respectively. Seedling tissues were sampled at 0, 1.0 and 3.0 h after changing the nutrient solution (on the dash-dot line at the right). Leaf, A and B, G and H; stem, C and D, I and J; and root, E and F, K and L.

