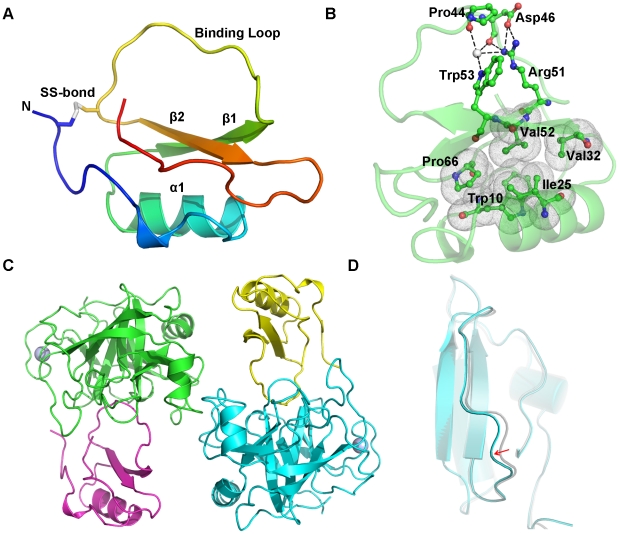
Figure 1.
(A) Cartoon representation of the overall structure of rBTI. Different structural elements are shown in different colors, and the disulfide bridge is indicated. (B) A view of the hydrogen-bonding network and the hydrophobic core in rBTI. rBTI is shown in a cartoon presentation in green. Residues involved in hydrogen-bonding network and hydrophobic core are shown as ball-and-stick models. The grey sphere indicates a water molecule. Hydrogen bonds are indicated by black dashes and hydrophobic interactions are indicated by dotted clouds. (C) Overview of the structure of rBTI-trypsin complexes within an asymmetric unit. rBTIs are shown in yellow and magenta; trypsins are shown in green and cyan. The calcium ions in trypsin are shown as light-blue spheres. (D) Superposition of trypsin-bound rBTI and free rBTI. The binding loop of trypsin-bound rBTI (cyan) is shifted by a small distance from that of free rBTI (grey). The RMSD value calculated by superposition of trypsin-bound rBTI's and free rBTI's binding loops is 0.26 Å.

