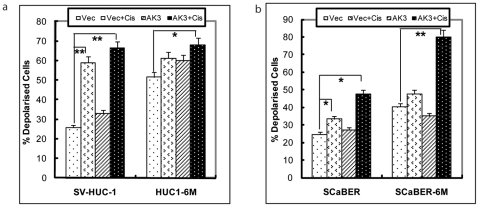
Figure 2. ΔΨm Alteration by AK3 in the Presence of Cisplatin.
Mitochondrial membrane potential was measured in SV-HUC1, HUC1-6M (a), SCaBER and SCaBER-6M (b) cells transfected with AK3 or control vector, followed by treatment with cisplatin for 48 h. Cells were stained with JC-1 reagent and cell fluorescence was measured on a flow cytometer using Fl1 and Fl2 channels. Increase of red fluorescence indicates hyper-polarization of mitochondrial membrane potential (ÄΨm). * indicates P<0.05 and ** indicates P<0.01.

