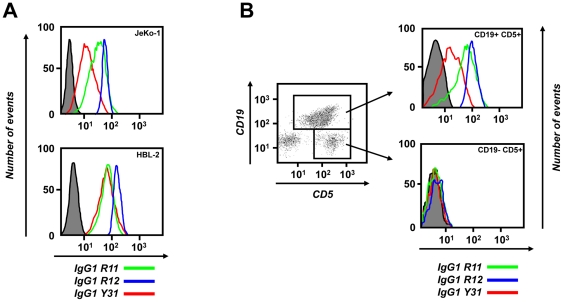
Figure 6. Cell surface binding.
Flow cytometry was used to analyze the binding of IgG1 R11 (green line; 5 µg/mL), R12 (blue line; 1 µg/mL), and Y31 (red line; 5 µg/mL) to (A) the surface of JeKo-1 (top) and HBL-2 cells (bottom) and (B) PBMC from patient CLL-1. The gray shade indicates the background observed with TT11 (A; 5 µg/mL) or P14 (B; 5 µg/mL). Biotinylated IgG1 alone (A) or in combination with FITC-CD19/APC-CD5 (B) were detected with PE-streptavidin. The y axis depicts the number of events, the x axis the fluorescence intensity.

