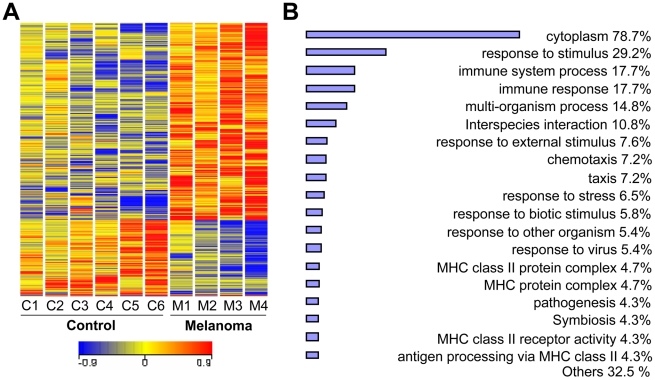
Figure 1. Microarray analysis of differentially expressed genes in melanoma.
A. Hierarchical clustering of differentially expressed genes. Whole blood samples were obtained from 4 newly diagnosed melanoma patients (stage IV, with no treatment, M1–M4) and 6 healthy control individuals (C1–C6). Clustering of 1187 transcripts in blood from melanoma patients and healthy control individuals (p<0.05). Colored spots indicate significant (p<0.05) upregulation (red) or downregulation (blue) of transcripts. Sample tree originated from the clustering of values with Euclidean distance analyzed by GeneSpringGX 10.0. B. Gene ontology analysis of differentiated expressed genes (p<0.05) between melanoma patients and healthy control individuals. Bar chart was drawn using gene ontology (p<0.01) tool from GeneSpringGX 10.0.

