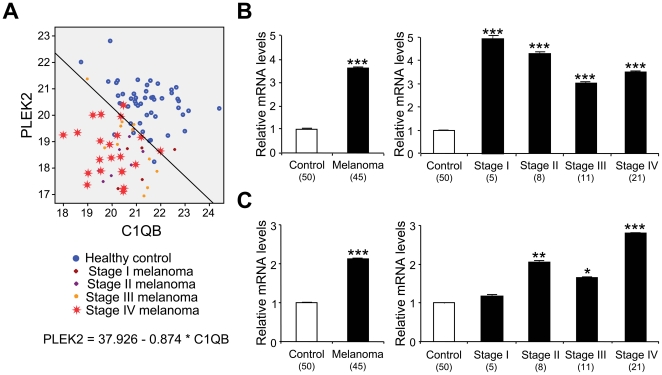
Figure 2. Expression of PLEK2 and C1QB in whole blood of melanoma patients and healthy control individuals by high-throughput qRT-PCR.
A. Two-gene model of PLEK2 and C1QB. The level of gene expression was evaluated using healthy control (n = 50), stage I melanoma (n = 5), stage II melanoma (n = 8), stage III melanoma (n = 11) and stage IV melanoma (n = 21). PLEK2 for each subject (y-axis) is plotted against C1QB (x-axis), and the best fit line demarcating healthy controls from melanoma patients is drawn. B. High-throughput qRT-PCR of PLEK2. The gene expression was evaluated using healthy control (n = 50), stage I melanoma (n = 5), stage II melanoma (n = 8), stage III melanoma (n = 11) and stage IV melanoma (n = 21), and normalized to the level from healthy controls. C. High-throughput qRT-PCR of C1QB. The gene expression was evaluated using healthy control (n = 50), stage I melanoma (n = 5), stage II melanoma (n = 8), stage III melanoma (n = 11) and stage IV melanoma (n = 21), and normalized to the level from healthy controls. The data are shown as means ± S.E. (Sample numbers analyzed are included in parentheses). *, p<0.05; **, p<0.01; ***, p<0.001 compared with healthy controls.

