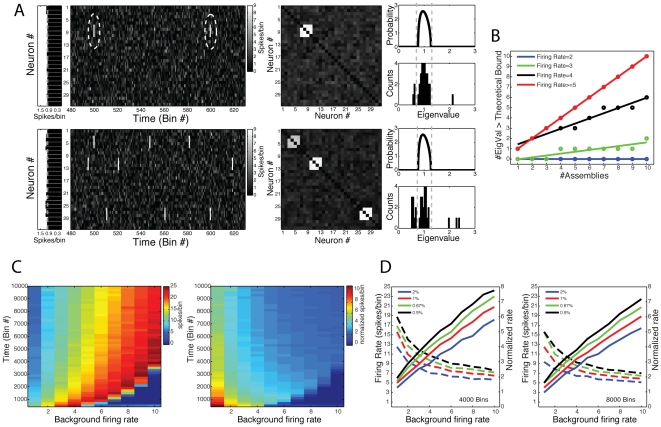
Figure 4. Eigenvalues above theoretical bound mark the number of cell assemblies.
(A) Top: (Left panels) Shown are binned spiking activity of a network composed of 32 neurons (second panel), along with the average firing rate of each neuron (first panel). Total simulation time was 8000 bins; neurons were modeled as possessing a Poissonian firing rate (mean = 1 spike/bin). In order to simulate a cell assembly, we set a group of neurons to activate simultaneously at 0.5% of the bins (firing rate within activation events = 6–9 spikes/bin). To facilitate visual inspection, neighbor neurons were chosen as composing the cell assembly (neurons #7, #8, #9, #10; dashed circle). (Middle Panel) Network correlation matrix. Notice a cluster of correlated activity corresponding to the cell assembly. (Right Panels) Theoretical eigenvalues distribution for independent neuronal activity (top panel), and the eigenvalues histogram computed from the simulated network (bottom panel). Notice that 1 eigenvalue lies above the theoretical upper limit predicted for random activity. Bottom: Same as above, but for a network presenting three cells assemblies (Cell assembly 1: neurons #3, #4, #5, #6; Cell assembly 2: #10, #11, #12, #13; Cell assembly 3: neurons #26, #27, #28, #29). Notice that three eigenvalues lie above the theoretical bound. (B) Number of eigenvalues above the theoretical bound as a function of the number of cell assemblies in the network for different values of firing rate during cell assembly activation events. Networks were composed of 40 neurons; neurons were simulated as Poissonian processes (background mean = 1 spike/bin). Total simulation time was 8000 bins; assembly activation frequency was set to 0.5% of the bins. Each cell assembly was composed by 4 neurons (non-overlapping). Colored lines denote the linear fit y = α+βx for each activation firing rate studied. Notice that the higher the firing rate within activation bins, the higher the slope coefficient (β). If the firing rate is high enough, β equals 1, which characterizes the regimes in which the number of eigenvalues perfectly corresponds to the number of cell assemblies. Each data point represents a single simulation result. (C) Pseudocolors denote the minimal firing rate within activation bins leading to β equal to 1 as a function of the background mean firing rate (x-axis) and total number of time bins (y-axis). Results are expressed as absolute values (left) and as a ratio relative to the background firing rate (right). Assembly activation frequency was set to 0.5% of the bins. Networks were composed by 40 neurons, and each cell assembly was composed by 10 neurons. For each parameter set, values represent the mean over 20 simulations. (D) Left panel: Black line represents a transection of the result in C for network activities of 4000 time-bins. Other colored lines represent equivalent results obtained for different frequencies of cell assembly activation, as labeled. Notice that the higher the frequency of cell assembly activation, the lower the minimal firing rate leading to β equal to 1. Colored dashed lines represent the same result but as a ratio to the background firing rate. Right panel: Similar results as before, but for a network activity composed of 8000 time-bins.

