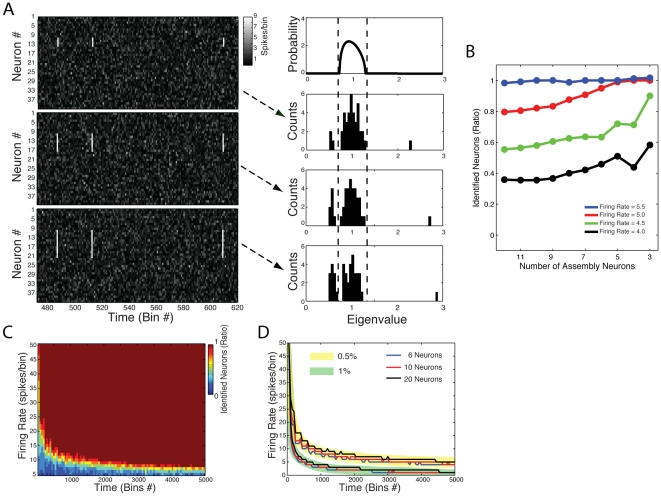
Figure 5. The number of eigenvalues lying outside the theoretical distribution limits corresponds to the number of cell assembly neurons.
(A) Shown are the binned spiking activity matrices of networks composed of 40 neurons (left panels), along with the predicted eigenvalues distribution for independent neuronal activity (top right panel) and the actual eigenvalue histogram (bottom right panels). Total simulation time was 8000 bins; neurons were modeled as possessing a Poissonian firing rate (mean = 1 spike/bin). The 3 cases depicted differ in the number of neurons that compose the cell assembly. Notice that, for all cases, the number of eigenvalues outside the theoretical limits (dashed lines) matches the number of neurons in the cell assembly. (B) Ratio of the number of eigenvalues outside theoretical limits to the number of cell assembly neurons (ratio = 1 means that the number of significant eigenvalues perfectly corresponds to the number of cell assembly neurons). Different data points denote the mean over 20 simulations for different number of cell assembly neurons (x-axis) and activation firing rates (colored lines), as labeled. Networks were composed of 40 neurons; neurons were simulated as Poissonian processes (background mean = 1 spike/bin). Total simulation time was 8000 bins; assembly activation frequency was set to 1% of the bins. (C) Pseudocolors denote the ratio of the number of eigenvalues outside theoretical limits to the number of cell assembly neurons as a function of the activation firing rate and total time bins. Values represent the mean over 20 simulations. Networks were composed of 40 neurons; the cell assembly was made of 10 neurons set to activate at a frequency of 0.5% of the bins. Notice that for each activation firing rate, a perfect estimation of the number of cell assembly neurons (ratio = 1) is achieved if the number of bins analyzed is large enough. (D) Minimal activation firing rate required for a perfect match between the number of eigenvalues outside predicted limits and the number of cell assembly neurons as a function of the number of analyzed bins. Different lines represent different cases varying in the number of neurons in the assembly and in the frequency of cell assembly activation, as labeled.

