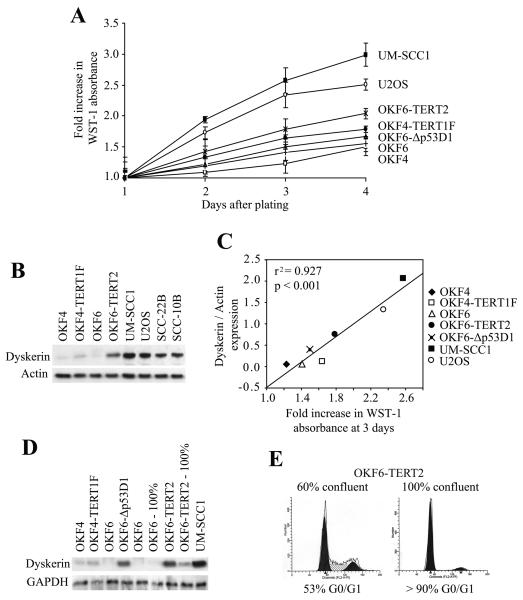
Figure 2. Dyskerin expression correlates with the rate of cell proliferation.
A, Fold increase in cell proliferation rates were determined by normalizing the relative WST-1 absorbance for each of the respective cell lines to those measured on the first day after plating. Error bars denote standard deviation from triplicate wells for each time point. Experiments were repeated twice with similar results. B, Cells were harvested in log growth phase (three days after initial plating) and total cell lysates were subjected to Western blot. Dyskerin was increased in the TERT-immortalized cells relative to their parental cells, and even more so in the transformed cells. For comparison purposes, dyskerin expression was also examined in the transformed squamous epithelial cell lines, SCC-10B and SCC-22B. C, Dyskerin expression was normalized to actin, and then compared to the fold increase in WST-1 absorbance three days after initial plating. A linear regression analysis showed strong correlation (r2 = 0.927, p < 0.001) between relative dyskerin levels and cell proliferation. D, Dyskerin expression was reduced in contact-inhibited OKF6 and OKF6-TERT2 cells (100%) relative to the exponentially growing cells (50%-60% confluent). Except where indicated, all protein lysates were obtained from actively proliferating cells. E, Cell cycle distribution of OKF6-TERT2 cells at 60% and 100% confluency. OKF6 cells showed a similar profile (not shown).

