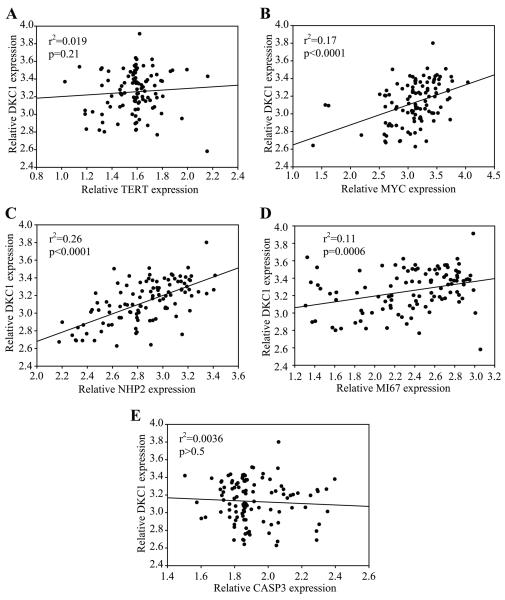
Figure 4. DKC1 and TERT mRNA expression do not correlate in transformed human cell lines.
A, A linear regression analysis of the log-transformed expression values revealed no correlation (r2 = 0.019, p=0.21) between TERT and DKC1 mRNA expression. B, DKC1 and MYC expression showed significant correlation (r2=0.17, p<0.0001). C, Relative levels of DKC1 and its H/ACA snoRNP binding partner, NHP2, also strongly correlated (r2=0.26, p<0.0001). D, DKC1 and the cell proliferation marker MKI67 also showed correlation (r2=0.11 p=0.0006). E, There was no correlation between DKC1 and CASP3 expression (r2=0.0036, p>0.5); CASP3 was randomly chosen as a factor that does not have any known relationship to DKC1. The raw data and corresponding log transformations for each of the genes are listed in Supplemental Table 2.

