
Fig 4.
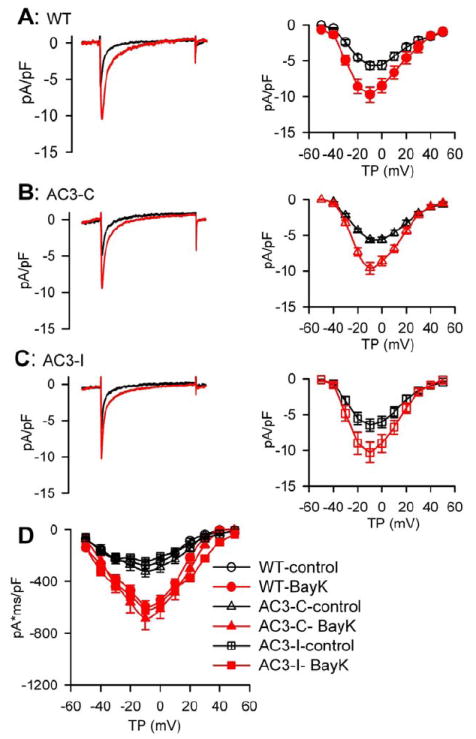
BayK equally increased ICa in AC3-I, AC3-C and WT SANCs. A-C. representative ICa traces (left panels) and I-V relationship (right panels) of peak currents before and after 1 μM BayK from WT (A), AC3-C (B) and AC3-I (C) mice. D. The integrated ICa I-V relationship from WT, AC3-C and AC3-I SANCs, under control conditions and in the presence of BayK, n=8-19 cells from more than 3 animimals for each group.