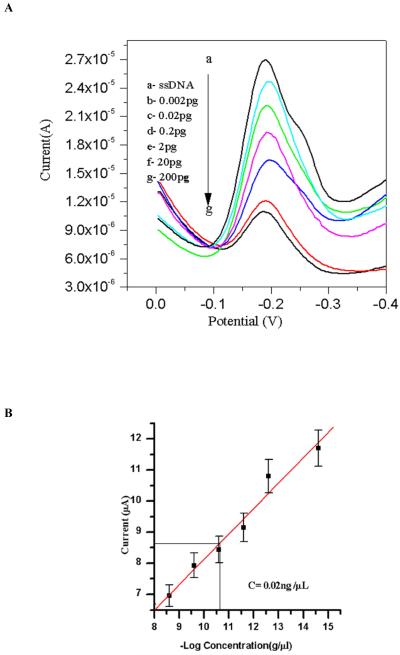
Fig.8.
(A) Differential pulse voltammograms (at a pulse height of 50 mV) of (a) ss-DNA/NiO/ITO bioelectrode and (b-d) showing response of the ss-DNA/NiO/ITO bioelectrode after hybridization (60 s hybridization time) with complementary target probe concentration 0.002pg -200pg in phosphate buffer saline and methylene blue (20 mM). (B) Showing the calibration graph of the same concentration range in which the unknown sample detected (detection limit is 0.02 ±0.002ng/μl).

