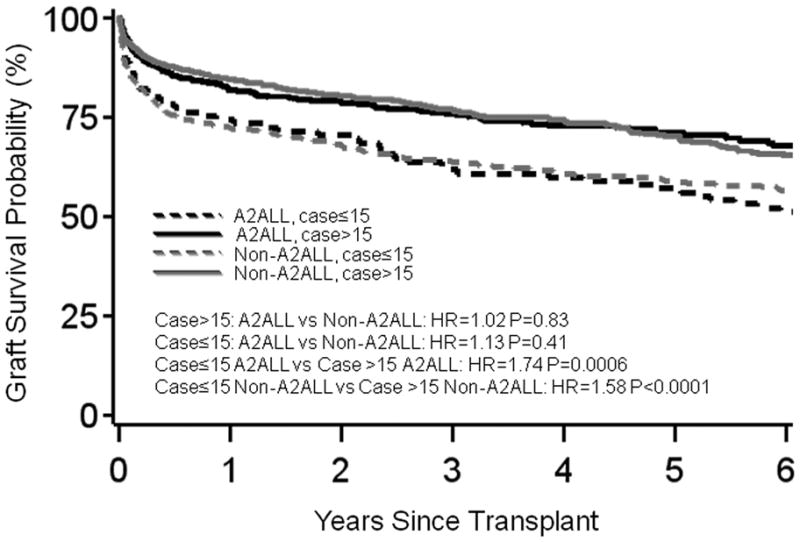
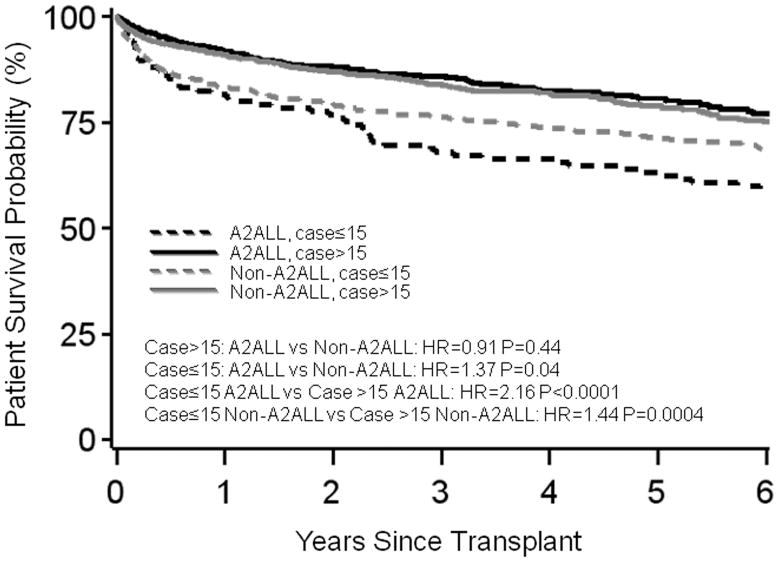
Figure 3.

(a) Patient survival or (b) graft survival by center type and case number from an adjusted model, plotted for the mean covariate values of recipient (50) and donor age (37) at transplant, HCC (0.07) and HCV (0.37) diagnoses, creatinine (−0.09), and medical condition (ICU=0.04, hospitalized=0.12). The graft survival model was also adjusted for recipient weight (77 kg).

