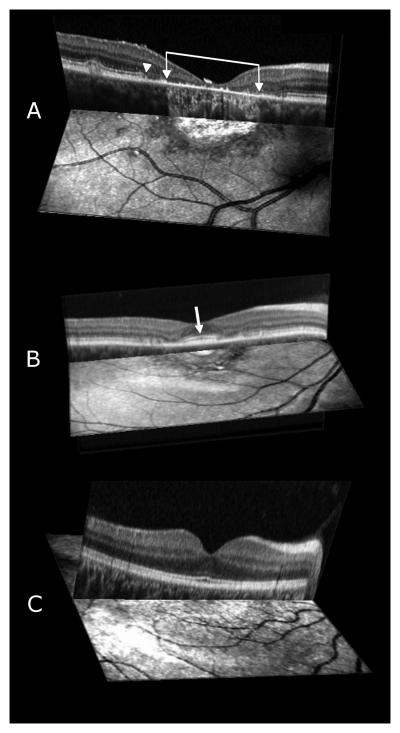
FIGURE 3.
(A, B, C) Three-dimensional images composed of an SD-OCT scan and a corresponding SLO infrared image of patient 5 with a geographic atrophic macular lesion (A), and patient 1 with a bull's eye-appearing macular lesion (B), and corresponding image from a control subject (C) respectively. Brackets with arrowheads enclose the atrophic macular lesion and white arrowhead shows the disruption of the IS-OS junction of the photoreceptors and ELM from patient 5 (Figure 3A). The white arrow on Figure 3B shows the increased thickness and brightness of the IS-OS junction of the photoreceptors in the foveal region of patient 1.

