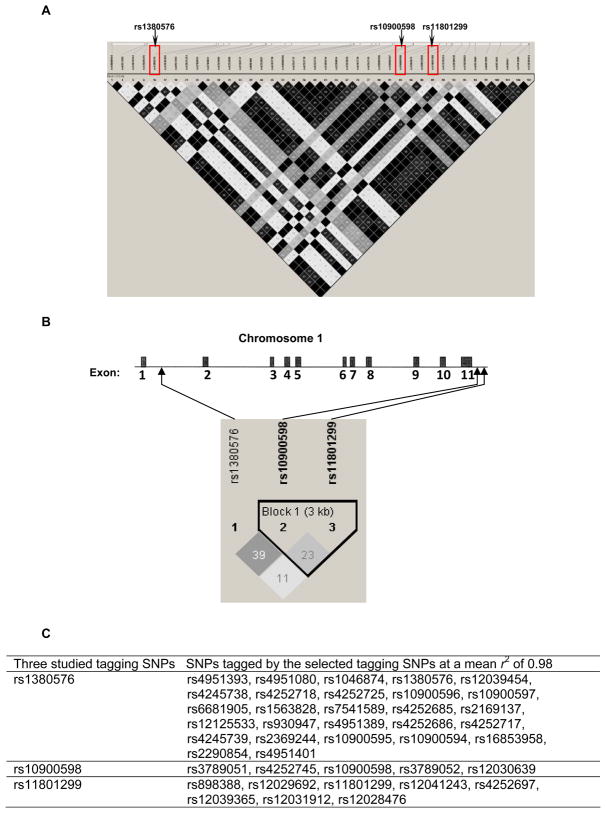
Fig. 1.
(A) The linkage disequilibrium structure of 40 common SNPs across the MDM4 region (chr1: 202,752,134 to 202,786,349) tagged by the 3 selected tagging SNPs among a European population (http://www.hapmap.org/). The matrix indicates the r2 value between each pair of SNPs. The darker, the stronger r2, with dark black representing r2 = 1 and pure white representing r2 = 0. (B) Gene structure of human MDM4, location of the three tagging SNPs in MDM4, and the linkage disequilibrium structure of the 3 selected tagging SNPs in 1,079 controls. The matrix indicates the r2 value between each pair of SNPs. (C) Selected tagging SNPs and SNPs tagged by the tagging SNPs.

