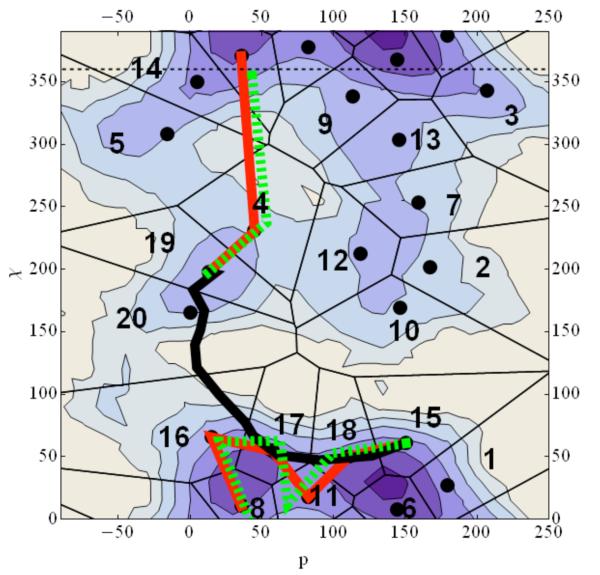
Figure 5.
A contour plot of the two-dimensional free energy profile for adenosine. Each contour corresponds to one kcal/mol change in free energy with dark blue being the lowest energy while white is the highest. Black dots are the cluster centers used for the Directional Milestoning. The black solid line is a steepest descent path from C3a to C2s computed with the functional “scalar force”37 while the red line is the Maximum flux reaction coordinate calculated from Directional Milestoning. The green dashed line is the SDP path if the initial guess for the SDP algorithm is the Maximum Flux Path. The black and red lines clearly illustrate the existence of multiple channels. Note that six coarse variables were used in the Milestoning calculation and the picture shown is a projection onto two dimensions. The projection is not always successful. For example, in the transition from χ≅220 to χ≅360 it seems (incorrectly) that several Milestones are crossed in one transition.

