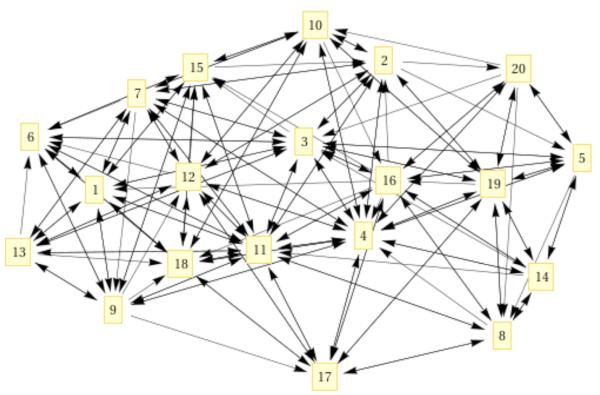
Figure 7.
A connectivity graph of each cell with its neighbors. Nodes are centers of clusters and edges represent local transition pathways. The arrows indicate the direction of the transition. From detailed balance we expect every transition to be reversal. However, some transitions between nearby milestones are very rare and are not sampled. These transitions do not impact the overall rate.

