
Figure 3. Plasma α-tocopherol concentrations.
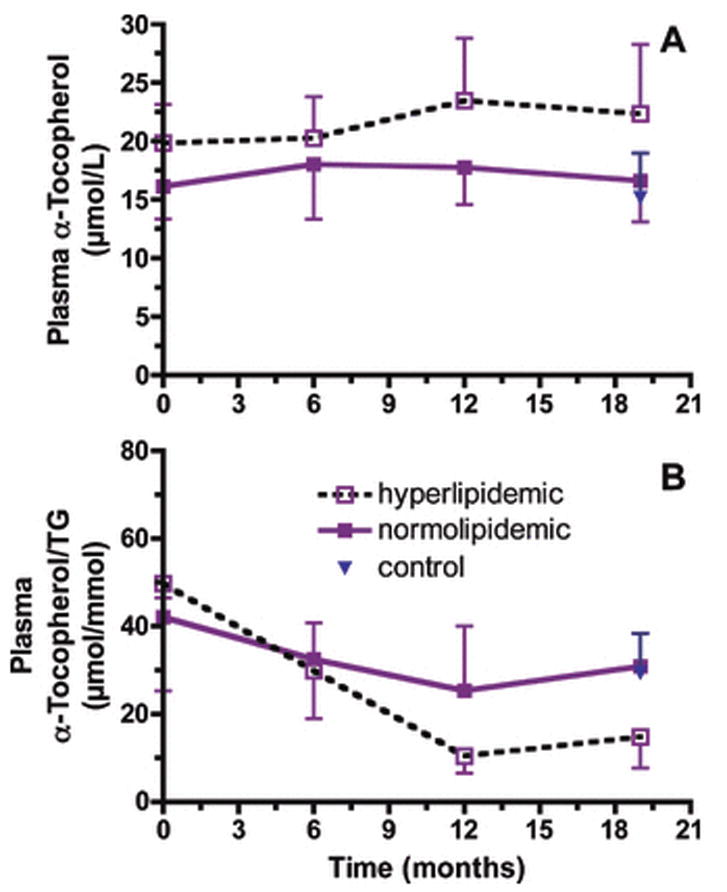
Plasma α-tocopherol concentrations (μmol/L, mean ± SD) did not change over time and were not significantly different between groups (A). Plasma α-tocopherol per triglyceride ratios (μmol/mmol, mean ± SD) varied differently between groups (time × group interaction, P=0.0418). Ratios at 19 months in hyperlipidemic animals were significantly less than those in the normolipidemic drinker (P<0.05) or control (P<0.05) monkeys.