
Fig. 1.
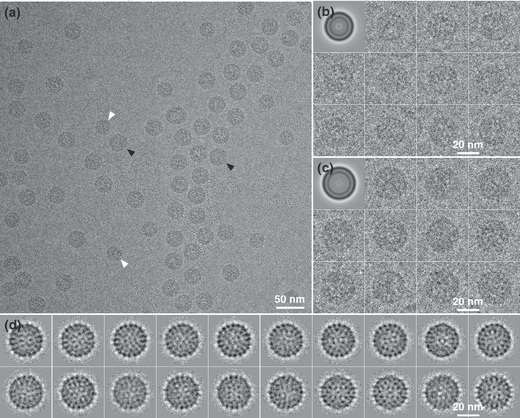
(a) Cryo-electron microscopy of HBV/G core-like particles. T = 3 particles (white arrows) and T = 4 particles (black arrows) are shown. Panels (b) and (c) illustrate the sorting of the T = 3 capsids from T = 4 capsids, respectively. The rotational average (top left in panels b and c) was used as a reference for sorting. Several representative sorted particles are presented. Characteristic class averages generated by projection matching for the T = 4 reconstruction are shown in (d).