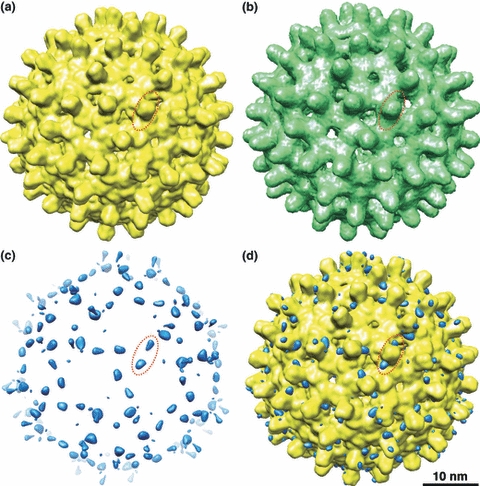
Fig. 2.

Surface shaded representation of the HBV/A capsid structure solved by X-ray crystallography (yellow), and HBV/G capsid structure solved by cryoEM (green) are shown in (a) and (b), respectively. Structures are Fourier filtered to 14 Å resolution for comparison. A difference map (c, shown in blue) was created by subtracting the HBV/A capsid structure from the HBV/G core structure is presented with a mass threshold set to account for the 12 extra residues from the HBV/G cryo-EM map. Panel (d) shows the difference map (blue) superimposed over the HBV/A core crystal structure (yellow). In all four panels, a red oval has been superposed over the reconstruction to highlight a single dimer spike in the structures at the base of the spike.
