
Fig. 3.
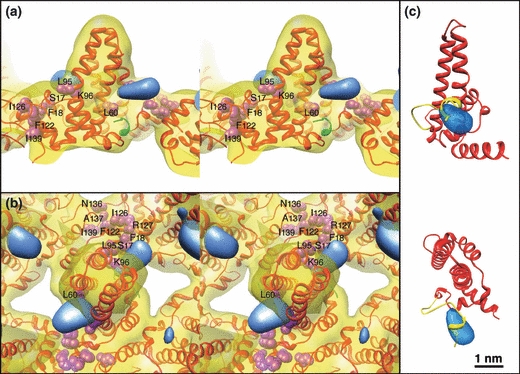
(a) and (b). Stereo images of the HBV/A core protein structure. The red ribbon is the HBV/A core crystal structure, PDB accession 1QGT, and the yellow density is the structure derived from the HBV/A core X-ray crystallography data displayed at 14 Å resolution, to match resolution of the difference map shown in blue. The additional mass found on HBV/G (blue density) was determined by subtracting the HBV/A structure from the HBV/G structure. (a) The mass from the extra 12 amino acids on the N-terminal end of HBV/G is near to the N-terminal end of the HBV/A core (the portion of the ribbon coloured green). (b) Top view looking down one of the spike 2-fold axes. Locations of the amino acids critical for the encapsidation of the mature HBV particle, and that interact with the cytoplasmic domains of the HBsAg, are shown as purple spheres. The extra mass from the 12 amino acid insert may stearically interfere with access to some of these residues (notably S17, F18, L60, L95). (c) Side and top views of HBV/G core protein model (red ribbon) with the12 residue N-terminal insertion (yellow ribbon) modelled into the difference map density (transparent blue). Only one copy of the core molecule within the dimer is shown for clarity.