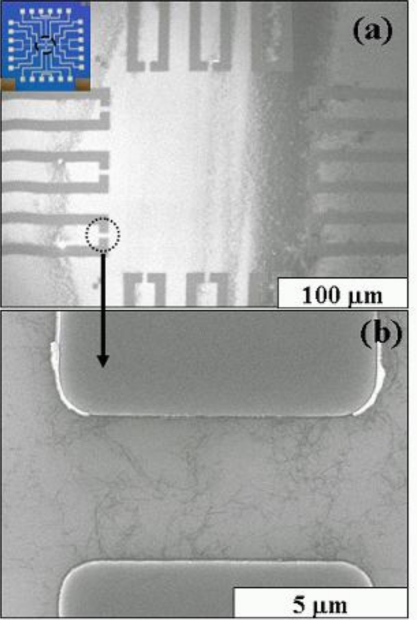
Figure 3.
FE-SEM images of the molybdenum electrodes. (a) Twelve pairs of Mo Electrodes (inset: 1 × 1 cm area of the patterned electrode); (b) Dispersed SWCNTs between two Mo electrodes in the region outlined with the black dotted circle in (a). The scale bars in (a) and (b) are 100 μm and 0.5 μm, respectively.

