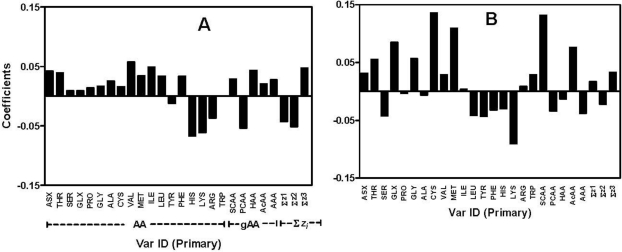
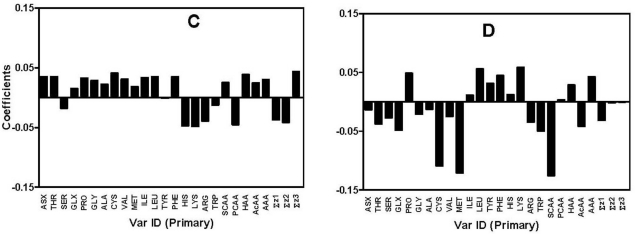
Figure 3.
Coefficient plots of scaled and centered data of the partial least square regression models: (A) DPPH radical scavenging; (B) ferric reducing antioxidant power (FRAP); (C) H2O2-scavenging; and (D) superoxide radical-scavenging. The importance of a given X-variable is proportional to its distance (coefficient value) from the origin (zero). Above zero values indicate positive contributions while values less than zero indicate negative contributions.


