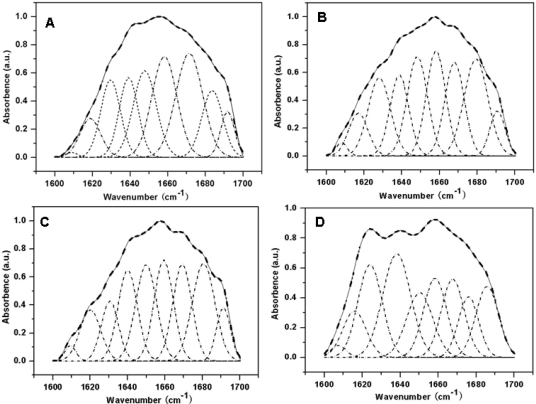
Figure 2.
Curve-fitted spectra of various sericin films at amide I band between 1600–1700 cm−1: (A) sericin film; (B) sericin film with 10 wt% glycerol; (C) sericin film with 20 wt% glycerol; (D) sericin film with 30 wt% g 0.39″ lycerol. The broken lines represent the Gaussian fitted curves and the solid lines represent the deconvolution spectra of amide I band.

