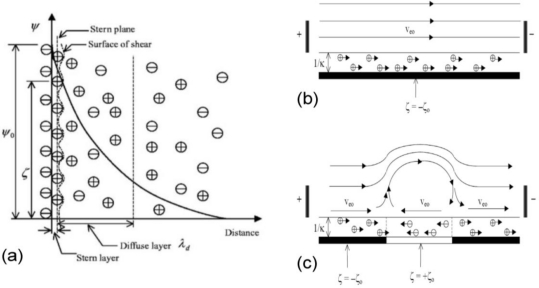
Figure 21.
Schematic illustration of electrical double layer (EDL) and electroosmotic flow near the EDL: (a) the EDL next to a negatively charged solid surface (ψ is the EDL potential, ψ0 is the surface electric potential, ζ is the zeta potential); (b) a homogeneous surface (ζ = −ζ0) and (c) a homogeneous surface with a heterogeneous region (ζ = +ζ0), ζ0 > 0 [82].

