
Figure 1. Structure and mutation distribution of PTPRT.
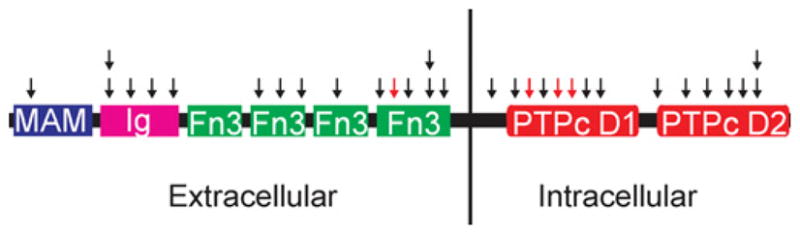
Black arrows indicate missense mutations and red arrows indicate nonsense or frame-shift mutations. Boxes represent functional domains. MAM, meprin/A5/PTP μ; Ig, immunoglobulin; Fn3, fibronectin type III; PTPc D1, first phosphatase catalytic domain; PTPc D2, second phosphatase catalytic domain