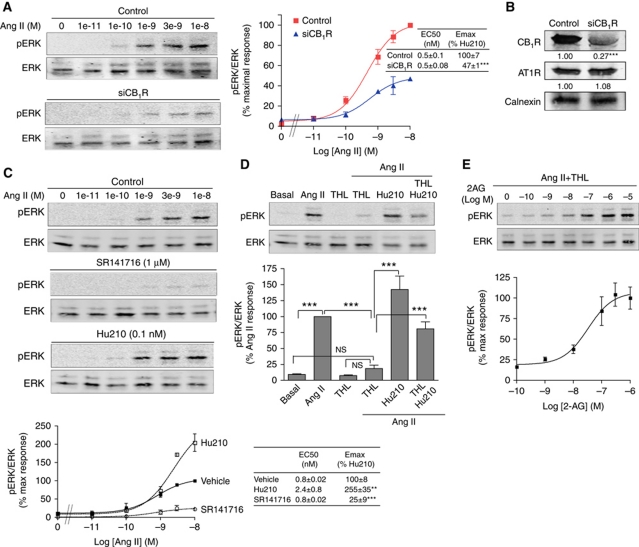
Figure 1.
CB1R modulates AT1R signalling. (A) Neuro2A-AT1R cells transfected or not with a siRNA to CB1R were stimulated with increasing concentrations of Ang II for 3 min. Data represent mean±s.e.m. (n=3–5). ***P<0.001. (B) Representative western blot analysis of Neuro2A-AT1R cells transfected with control or CB1R-targeting siRNA and probed for the levels of CB1R (∼70% decrease with CB1R siRNA), AT1R (no change) and calnexin as a loading control. Mean±s.e.m. densitometry from three independent transfections are indicated below the western blot. ***P<0.001. (C) Neuro2A-AT1R cells starved for 4 h, were stimulated with increasing concentrations of Ang II for 3 min, in the presence of the CB1R antagonist (SR141716; 1 μM) or in the presence of a non-signalling dose of the CB1R agonist (Hu210; 0.1 nM). Data represent mean±s.e.m. (n=3–5). **P<0.01; ***P<0.001. (D) Phospho-ERK levels after Ang II stimulation were examined in Neuro2A-AT1R cells, after treatment with the diacylglycerol lipase inhibitor THL (1 μM; 2 h pretreatment) alone or together with Hu210 (0.1 nM); or, (E) with increasing concentrations of 2-AG. Data are expressed as the mean±s.e.m. (n=3–4). **P<0.01; ***P<0.001; NS, non-significant. Cell lysates were subjected to western blotting analysis using antibodies to pERK and ERK (1:1000). Imaging and quantification was carried out using the Odyssey Imaging system (Li-Core Biosciences).

