Figure 2.
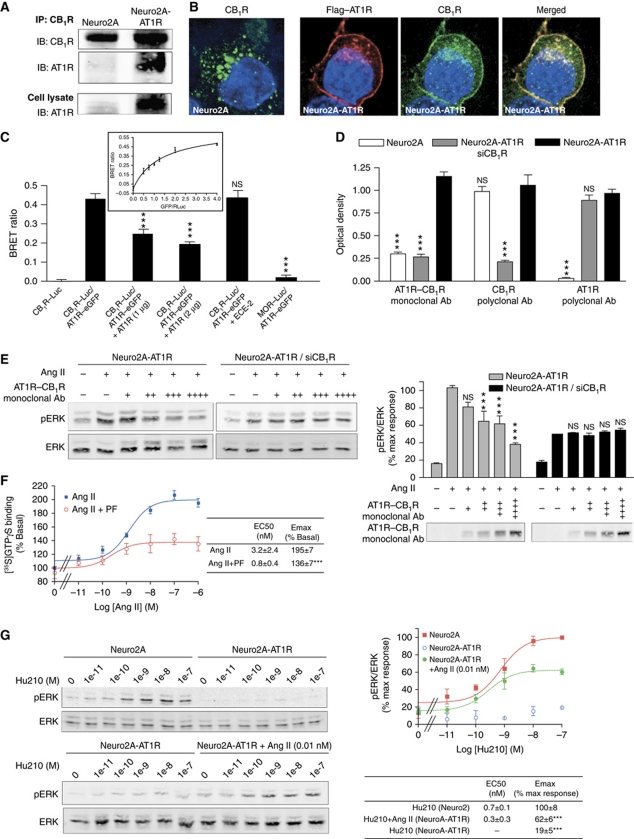
Interaction between AT1R and CB1R. (A) Association of AT1R and CB1R in Neuro2A-AT1R. Lysates from Neuro2A and Neuro2A-AT1R were subjected to immunoprecipitation using a protein A agarose-coupled anti-CB1R antibody (1 μg), and to western blotting analysis with an anti-AT1R antibody (1:200). AT1R is detected in the CB1R immunoprecipitate from Neuro2A-AT1R. (B) Immunofluorescence and confocal microscopy analysis of Neuro2A cells expressing endogenous CB1R and of Neuro2A cells stably expressing Flag–AT1R. Cells grown on coverslips were fixed with 4% PFA, permeabilized in 0.1% Triton X-100, and stained with primary rabbit polyclonal anti-CB1R (1:500) and mouse monoclonal M2 anti-Flag (1:1000) antibodies. After fluorescent secondary antibody staining, the coverslips were mounted with mowiol. Slides were examined with a Leica SP5 confocal microscope. (C) Detection of AT1R–CB1R heteromers by BRET in living HEK293 cells. BRET experiments were carried out using C-terminally Renilla luciferase-tagged CB1R, and eGFP-tagged AT1R (∼400–500 fmol receptor/mg protein). BRET ratio was measured in cells expressing the indicated constructs. To assess the specificity of interaction, BRET ratios were measured in cells coexpressing increasing concentrations of untagged AT1R, in cells coexpressing untagged endothelin converting enzyme-2, or in cells coexpressing MOR–Luc with AT1R–eGFP. In addition, BRET saturation curve was generated (insert). HEK-293 cells were co-transfected with a constant DNA concentration of CB1R–Rluc and increasing DNA concentrations of AT1R–eGFP. Curves were fitted using a non-linear regression equation assuming a single binding site (GraphPad Prism). Results are mean values±s.e.m. (n=3 experiments). ***P<0.001; NS, non-significant, versus CB1R–Luc/AT1R–eGFP. (D) Detection of AT1R–CB1R heteromers with heteromer-selective monoclonal antibodies. Receptor abundance was determined in Neuro2A, Neuro2A-AT1R, and Neuro2A-AT1R cells where CB1R was downregulated by RNAi (Neuro2A-AT1R siCB1R) with a monoclonal antibody to AT1R–CB1R, or polyclonal antibodies to AT1R or CB1R by ELISA. Results are mean values±s.e.m. (n=3 experiments). ***P<0.001; NS, non-significant, versus Neuro2A-AT1R. (E) Inhibition of AT1R–CB1R signalling by the AT1R–CB1R heteromer antibody. Neuro2A-AT1R and Neuro2A-AT1R cells where CB1R was downregulated by RNAi (Neuro2A-AT1R/siCB1R) were incubated with increasing concentrations of the monoclonal anti-AT1R–CB1R antibody (hydridoma supernatant, +, 1:20 v/v; ++, 1:10 v/v; +++, 1:5 v/v; ++++, 2:5 v/v) for 30 min, and then were stimulated with 10 nM Ang II for 3 min. Cell lysates and media were subjected to western blotting analysis using antibodies to pERK and ERK (1:1000) (lysate) and anti-mouse IgG (media). Imaging and quantification were carried out using the Odyssey Imaging system (Li-Core Biosciences). Results are mean values±s.e.m. (n=4 experiments). ***P<0.001; NS, non-significant, versus the corresponding Ang II treatment. (F) [35S]GTPγS-binding assay. Membranes from Neuro2A-AT1R cells were treated with increasing concentrations of the AT1R agonist Ang II, in the absence or presence of the CB1R antagonist PF514273 (1 μM). [35S]GTPγS binding was measured as described in ‘Materials and methods’. Results are mean values±s.e.m. (n=3 experiments). ***P<0.001. (G) Reciprocal regulation of CB1R signalling by AT1R. Neuro2A or Neuro2A-AT1R cells were incubated in the presence of increasing concentrations of Hu210 for 5 min, in the absence or presence or 0.01 nM Ang II. Data represent mean±s.e.m. (n=3). ***P<0.001.

