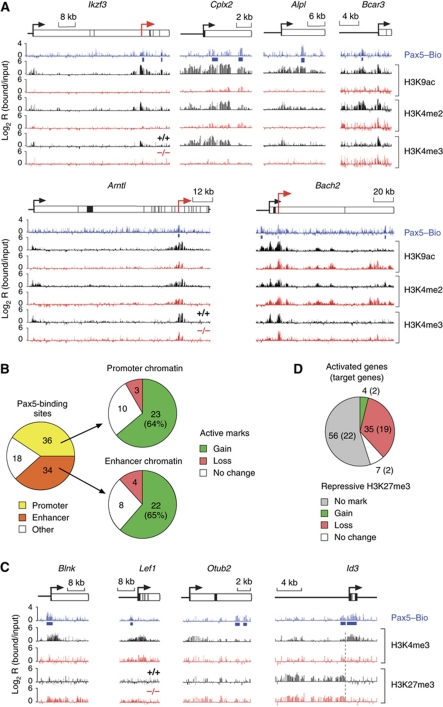
Figure 3.
Chromatin changes at activated Pax5 target genes. (A) Induction of active chromatin by Pax5. Pax5+/+ (+/+, black) and Pax5–/– (–/–, red) pro-B cells on a Rag2-deficient background were used for ChIP-chip analysis with antibodies detecting H3K4me2, H3K4me3 and H3K9ac. Pax5 binding was determined by Bio-ChIP-chip analysis of Pax5Bio/Bio Rag2–/– pro-B cells (Pax5–Bio, blue). Blue bars denote significant Pax5 peaks identified by peak-finder analysis. Red arrows denote newly identified putative promoters. (B) Statistical evaluation of chromatin changes at promoter and enhancer regions of activated Pax5 target genes. Promoters and putative enhancers were defined by the chromatin signature H3K4me3+ and H3K9ac+ H3K4me2+ H3K4me3–, respectively. ‘Other’ refers to other assortments of active histone marks, which primarily corresponded to the combination H3K9ac– H3K4me2+ H3K4me3–. Pax5-dependent gain, loss or no change of active histone marks was evaluated for Pax5-binding sites at promoter and enhancer positions in Pax5+/+ Rag2–/– pro-B cells compared with Pax5–/– Rag2–/– pro-B cells. (C) Conversion of repressive to active chromatin at promoter regions of Pax5-activated genes. Active H3K4me3 and repressive H3K27me3 modifications as well as Pax5-binding sites were mapped by ChIP-chip analysis of the respective pro-B cell type. (D) Pie diagram describing the changes of repressive chromatin (H3K27me3) at activated genes in Pax5+/+ Rag2–/– pro-B cells compared with Pax5–/– Rag2–/– pro-B cells. All 102 Pax5-activated genes present on the microarray were evaluated. The result obtained with direct Pax5 target genes is shown in brackets.

