
Fig. 4.
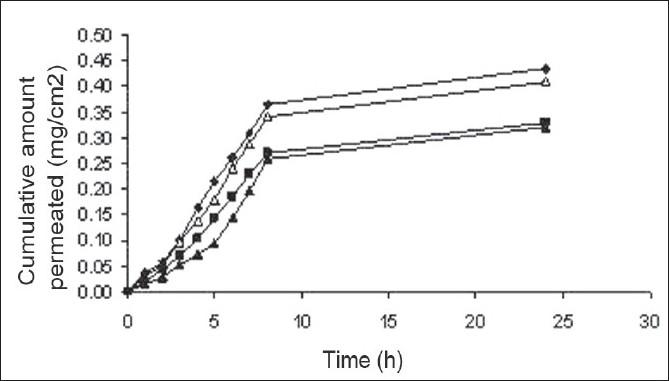
Lecithin effect on in vitro drug permeation profile
Effect of lecithin concentration on in vitro cumulative amount of drug permeation from various formulations ETL1 (—▲—), ETL2 (—♦—), ETL3 (—Δ—) and ETL4 (—■—)
Official websites use .gov
A
.gov website belongs to an official
government organization in the United States.
Secure .gov websites use HTTPS
A lock (
) or https:// means you've safely
connected to the .gov website. Share sensitive
information only on official, secure websites.
Lecithin effect on in vitro drug permeation profile
Effect of lecithin concentration on in vitro cumulative amount of drug permeation from various formulations ETL1 (—▲—), ETL2 (—♦—), ETL3 (—Δ—) and ETL4 (—■—)