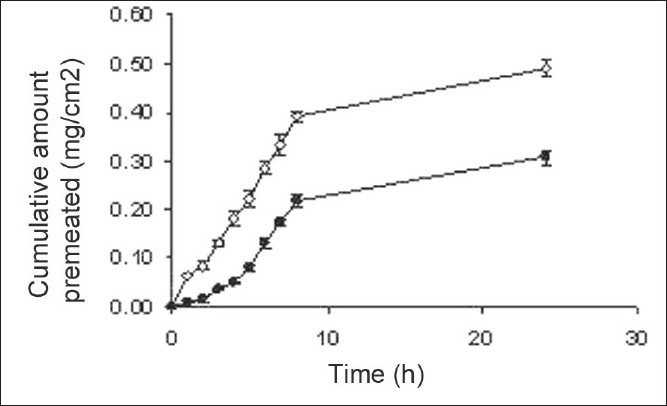
Fig. 6.

In vitro drug permeation profile of optimized ethosomal formulation
In vitro permeation study of optimized ethosomal formulation ETP2 (—◊—) and comparison with marketed preparation Movon gel (—●—)

In vitro drug permeation profile of optimized ethosomal formulation
In vitro permeation study of optimized ethosomal formulation ETP2 (—◊—) and comparison with marketed preparation Movon gel (—●—)