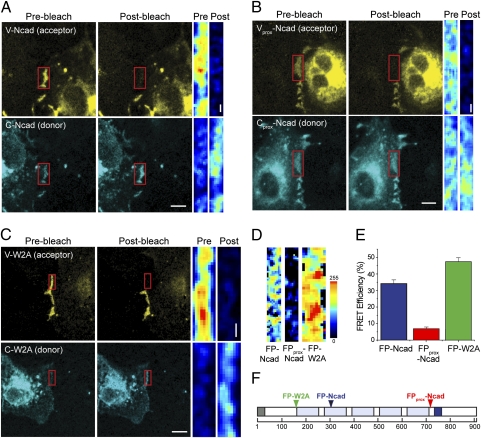
Fig. 2.
Detecting N-cadherin interactions under basal conditions across cell–cell junctions. A representative example of a cell–cell junction of two adjacent transfected COS-7 cells expressing (A) V-Ncad or C-Ncad, (B) Vprox-Ncad or Cprox-Ncad, and (C) V-W2A or C-W2A fusion proteins under basal high Ca2+ conditions (1.8 mM Ca2+). The acceptor (Venus fusion protein) was bleached within the ROI (red box); images were acquired before and after bleaching (see D for color look-up table). (Scale bars: images, 10 μm; corresponding ROIs, 1 μm.) (D) Quantitative spatial FRET maps for each of the examples shown in A–C, respectively, show the heterogeneity of cadherin interactions at cell–cell contact. (Scale bar: same as for corresponding ROIs in C.) (E) Average FRET efficiencies for WT, W2A, and WTprox N-cadherin junctions. Error bars indicate ± SEM for n = 10 cells each. (F) N-cadherin domain structure indicating the W2A mutation (green; FP-W2A), and distal (blue; FP-Ncad) and proximal (red; FPprox-Ncad) insertion sites for FRET reporter constructs.

