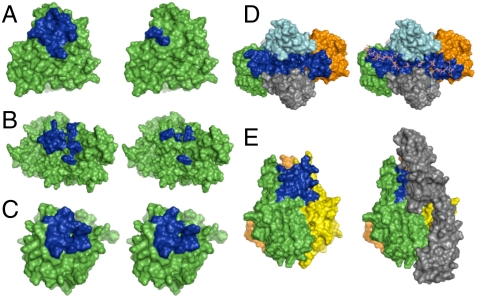
Fig. 1.
(A and B) CS-A binding site (blue) on the DBL6 (A) and DBL3x (B) domains of VAR2CSA, as predicted by computational modeling (Left) and mutagenesis (Right). (C) Hep binding site (blue) on FGF2 as predicted computationally (Left) and determined crystallographically (Right). (D) Hep binding site (blue) in the FGF2-FGFR1 complex as predicted computationally (Left) and determined crystallographically (Right). The two FGF2 subunits are shown in green and orange, and the two FGFR1 subunits are shown in light blue and gray. (E) Predicted CS-E binding site (blue) in the trimeric structure of TNF-α (Left). Homology model of the TNF-α-TNFR1 complex (Right) shows that the CS-E binding site overlaps with the TNFR1 binding site. TNFR1 is depicted in gray.

