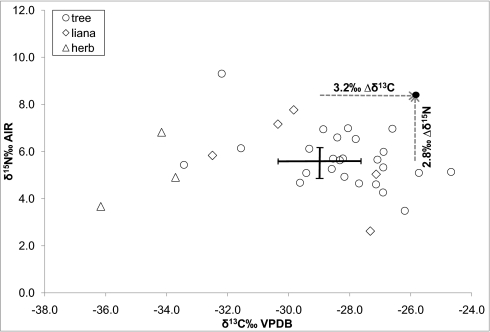
Fig. 1.
Isotope ratios of plant samples from Salonga sorted by plant type, mean value for all floral samples (SD 1σ), and the mean value (black dot) of all bonobo hair samples (n = 143). The dashed arrows display the fractionation (Δ) between mean plant diet and the mean bonobo hair keratin values. The analytical error for δ13C and δ15N is <0.2%.

