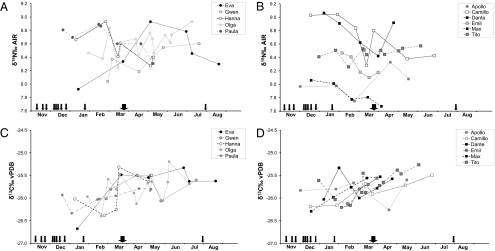
Fig. 3.
Individual bonobo hair isotope ratios plotted chronologically (December 2008–August 2009). The variation in δ15N for females (A) and males (B) is shown, as is the variation in δ13C for females (C) and males (D). Each hair sample was cut into sections, and each data point represents the mean point in time of the respective hair section. For 10 mm of sectioned hair, we calculated 28 d; a month here represents 30.5 d. Each arrow represents an observed event of faunivory (mammals, birds, and caterpillars), and its thickness indicates the relative amount of consumed vertebrate and nonvertebrate protein.

