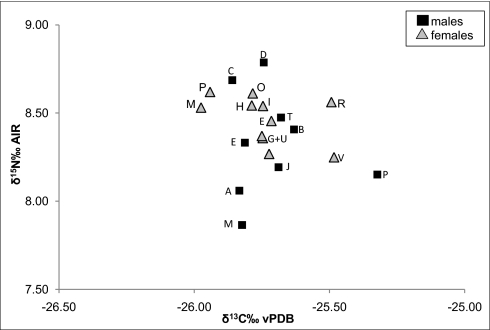
Fig. 4.
Mean isotope values (1σ SD) of hair samples for each individual bonobo of the study community. The initial next to each data point refers to the individual name of each male (square) and female (triangle). See Table S3 for further details. Analytical error is <0.2%.

