Fig. 5.
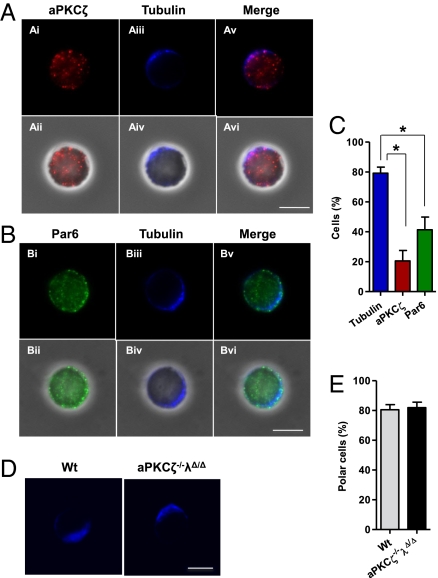
aPKCζ and Par6 are not polarized in HSC and aPKCs do not regulate HSC polarization. (A) Immunofluorescence pictures showing aPKCζ (red) along with tubulin (blue) localization in LT-HSCs. (Ai, Aii) aPKCζ is detected diffusely in the cell cytoplasm without any specific asymmetric distribution in most of LT-HSCs. (Aiii, Aiv) Most of LT-HSCs display a highly polarized distribution of the microtubule network. (Scale bar, 5 μm.) (B) Immunofluorescence pictures showing Par6 (green) along with tubulin (blue) localization in LT-HSCs. (Bi, Bii) Par6 is distributed throughout the cell body and beneath the cell membrane. Par6 localization is not polarized in most of LT-HSCs. (Biii, Biv) LT-HSCs display a highly polarized distribution of the microtubule network. (Scale bar, 5 μm.) (C) Bar diagram showing quantification of immunofluorescence analysis. Fifty to 100 LT-HSCs were singularly analyzed in each experiment (n = 4). Error bars represent SEM of the number of tubulin (79.7%), aPKCζ (21.53%), and Par6 (41.24%) polarized cells scored per sample. *P < 0.05. (D) Immunofluorescence pictures showing tubulin (blue) localization in LT-HSCs isolated from wild type or aPKCζ- and aPKCλ-deficient mice. Most of LT-HSCs display a highly polarized distribution of the microtubule network (n = 3–4 mice per group) (Scale bar, 5 μm.) (E) Bar diagram showing quantification of immunofluorescence analysis (n = 30–50 LT-HSCs from individual mouse). Error bars represent SD.

