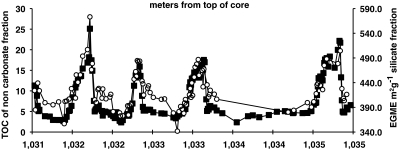
Fig. 1.
TOC (squares) and MSA (circles) compared to distance below sea floor in ODP site 959 for four 22 ky cycles. MSA closely follows increase in TOC. Abrupt shifts in TOC from base level to > 20% occur over single samples, suggestive of a threshold. These results are presented for the siliciclastic portion of the sediment to remove the effects of dilution by other phases such as carbonate.

