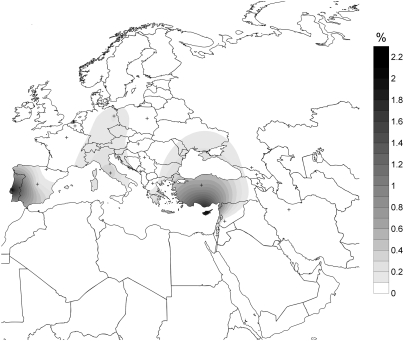
Fig. 3.
Map showing the Y-lineages shared between Treilles individuals and current European populations. Crosses denote the location of modern-day populations used in the analysis. The gray gradient indicates the percentage of shared lineages between modern local populations and ancient samples: the highest percentages are in black and the weakest are in gray.

