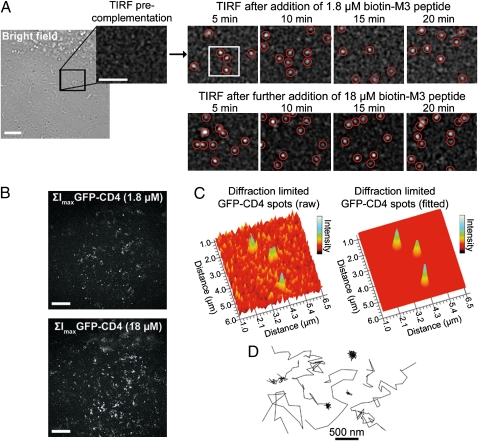
Fig. 3.
SM imaging and tracking of extracellular GFP 1–10-CD4 proteins by CALM. (A) A region of interest (black square) in the plasma membrane of a U2OS cell stably expressing GFP 1–10-CD4 is imaged by TIRF before and after complementation with biotin-M3 peptides at different incubation times. Diffraction-limited single GFP-CD4 spots appear and diffuse in the plasma membrane within minutes of M3 peptide addition. Single GFP-CD4 spots are intentionally expanded to facilitate visualization. (Scale bar: 5 μm.) (B) Pixel-based maximum intensity projections (ΣImax) TIRF images of all complemented GFP-CD4 detected during 20-min complementation with 1.8 or 18 μM biotin-M3 peptides (Movie S6). The field of view corresponds to the bright field image in A. (Scale bar: 5 μm.) (C) 3D rendering of raw and Gaussian-fitted diffraction-limited spots corresponding to individual complemented GFP-CD4 in the cell plasma membrane (white square in A). (D) Representative trajectories from single GFP-CD4 diffusing in the plasma membrane of U2OS cells during CALM imaging.

